PASADENA, Calif., July 27, 2020 /PRNewswire/ -- Alexandria Real Estate Equities, Inc. (NYSE:ARE) announced financial and operating results for the second quarter ended June 30, 2020.
|
Key highlights
|
|
|
|
|
|
|
|
|
|
Operating results
|
2Q20
|
|
2Q19
|
|
1H20
|
|
1H19
|
|
|
Total revenues:
|
|
|
|
|
|
|
|
|
|
In millions
|
$
|
437.0
|
|
$
|
373.9
|
|
$
|
876.9
|
|
$
|
732.7
|
|
|
Growth
|
16.9%
|
|
|
|
19.7%
|
|
|
|
|
Net income attributable to Alexandria's common stockholders – diluted
|
|
In millions
|
$
|
226.6
|
|
$
|
76.3
|
|
$
|
244.8
|
|
$
|
200.2
|
|
|
Per share
|
$
|
1.82
|
|
$
|
0.68
|
|
$
|
1.99
|
|
$
|
1.80
|
|
|
Funds from operations attributable to Alexandria's common stockholders – diluted, as adjusted
|
|
In millions
|
$
|
225.0
|
|
$
|
192.7
|
|
$
|
446.4
|
|
$
|
382.5
|
|
|
Per share
|
$
|
1.81
|
|
$
|
1.73
|
|
$
|
3.63
|
|
$
|
3.44
|
|
Alexandria and its tenants at the vanguard of advancing solutions for COVID-19
Safe and effective vaccines and therapies, in addition to widespread testing, are desperately needed to combat the global COVID-19 pandemic. Over 80 of our life science tenants are advancing solutions for COVID-19. By maintaining essential business operations across our campuses, Alexandria has enabled several of our life science tenants to continue mission-critical COVID-19-related research and development. Refer to "Alexandria and Its Innovative Tenants Are at the Vanguard of the Life Science Ecosystem Advancing Solutions for COVID-19" of this Earnings Press Release for additional details.
Strong and flexible balance sheet with significant liquidity
- $4.2 billion of liquidity as of June 30, 2020, pro forma for our $1.1 billion forward equity sales agreements entered into in July 2020.
- Zero debt maturing until 2023.
- 9.9 years weighted-average remaining term of debt as of June 30, 2020.
- Investment-grade credit rating, which ranks in the top 10% among all publicly traded REITs, of Baa1/Stable from Moody's Investors Service and BBB+/Stable from S&P Global Ratings, both as of June 30, 2020.
Continued dividend strategy to share cash flows with stockholders
Common stock dividend declared for 2Q20 of $1.06 per common share, aggregating $4.12 per common share for the twelve months ended June 30, 2020, up 25 cents, or 6%, over the twelve months ended June 30, 2019. Our FFO payout ratio of 59% for the three months ended June 30, 2020, allows us to share cash flows from operating activities with our stockholders while also retaining a significant portion for reinvestment.
A REIT industry-leading, high-quality tenant roster
- 51% of annual rental revenue from investment-grade or publicly traded large cap tenants.
- Weighted-average remaining lease term of 7.8 years.
Continued strength in collections drives lowest tenant receivables balance since 2012
- As of July 24, 2020, we have collected 99% of July 2020 rents and tenant recoveries.
- We have collected 99.4% of June 2020 rents and tenant recoveries.
- As of June 30, 2020, our tenant receivables balance was $7.2 million, our lowest balance since 2012.
High-quality revenues and cash flows, strong Adjusted EBITDA margin, and operational excellence
|
Percentage of annual rental revenue in effect from:
|
|
|
|
|
|
Investment-grade or publicly traded large cap tenants
|
|
51%
|
|
|
|
Class A properties in AAA locations
|
|
74%
|
|
|
|
Occupancy of operating properties in North America
|
|
94.8%
|
(1)
|
|
|
Operating margin
|
|
72%
|
|
|
|
Adjusted EBITDA margin
|
|
69%
|
|
|
|
Weighted-average remaining lease term:
|
|
|
|
|
|
All tenants
|
|
7.8
|
years
|
|
Top 20 tenants
|
|
11.2
|
years
|
|
|
|
|
|
|
(1)
|
Includes 647,771 RSF, or 2.3%, of vacancy in our North America markets, representing lease-up opportunities at properties recently acquired, primarily at our SD Tech by Alexandria campus (joint venture), 601, 611, and 651 Gateway Boulevard (joint venture), and 5505 Morehouse Drive. Excluding these vacancies, occupancy of operating properties in North America was 97.1% as of June 30, 2020. Refer to "Occupancy" in this Supplemental Information for additional details regarding vacancy from recently acquired properties.
|
Strong leasing activity in 2Q20 and continued rental rate growth
- Continued strong leasing activity in light of modest contractual lease expirations at the beginning of 2020 and a highly leased value-creation pipeline; continued rental rate growth in 1H20 over expiring rates on renewed and re-leased space:
|
|
2Q20
|
|
1H20
|
|
Total leasing activity – RSF
|
|
1,077,510
|
|
1,780,865
|
|
Leasing of development and redevelopment space – RSF
|
|
196,039
|
|
210,271
|
|
Lease renewals and re-leasing of space:
|
|
|
|
|
|
RSF (included in total leasing activity above)
|
|
699,130
|
|
1,251,152
|
|
Rental rate increases
|
|
37.2%
|
|
41.1%
|
|
Rental rate increases (cash basis)
|
|
15.0%
|
|
17.9%
|
Guidance for unique and opportunistic value-creation acquisitions and construction
Refer to next page for specific details.
Key items included in operating results
|
Key items included in net income attributable to Alexandria's common stockholders:
|
|
Amount
|
|
Per Share –
Diluted
|
|
Amount
|
|
Per Share –
Diluted
|
|
(In millions, except per share
amounts)
|
2Q20
|
|
2Q19
|
|
2Q20
|
|
2Q19
|
|
1H20
|
|
1H19
|
|
1H20
|
|
1H19
|
|
Unrealized gains on non-real
estate investments(1)
|
$
|
171.7
|
|
$
|
11.1
|
|
$
|
1.38
|
|
$
|
0.10
|
|
$
|
154.5
|
|
$
|
83.3
|
|
$
|
1.25
|
|
$
|
0.75
|
|
Impairment of real estate(2)
|
(13.2)
|
|
—
|
|
(0.11)
|
|
—
|
|
(22.9)
|
(3)
|
—
|
|
(0.18)
|
|
—
|
|
Impairment of non-real estate
investments(1)
|
(4.7)
|
|
—
|
|
(0.04)
|
|
—
|
|
(24.5)
|
|
—
|
|
(0.20)
|
|
—
|
|
Loss on early extinguishment of
debt
|
—
|
|
—
|
|
—
|
|
—
|
|
—
|
|
(7.4)
|
|
—
|
|
(0.07)
|
|
Preferred stock redemption charge
|
—
|
|
—
|
|
—
|
|
—
|
|
—
|
|
(2.6)
|
|
—
|
|
(0.02)
|
|
Total
|
$
|
153.8
|
|
$
|
11.1
|
|
$
|
1.23
|
|
$
|
0.10
|
|
$
|
107.1
|
|
$
|
73.3
|
|
$
|
0.87
|
|
$
|
0.66
|
|
|
|
|
|
|
|
|
|
|
|
|
|
|
|
|
|
(1)
|
Refer to "Investments" on page 46 of our Supplemental Information for additional details.
|
|
(2)
|
Primarily relates to an impairment charge of a previously pending acquisition in April 2020 of an operating tech office property to reduce the carrying amount of a pre-acquisition deposit to zero dollars, concurrently with the submission of our notice to terminate the transaction.
|
|
(3)
|
Amount includes $7.6 million related to our investment in a recently developed retail property held by our unconsolidated real estate joint venture and is classified in equity in earnings of unconsolidated real estate joint ventures within our consolidated statements of operations.
|
Guidance for unique and opportunistic value-creation acquisitions and construction
- Our initial 2020 guidance issued on December 3, 2019, included guidance midpoint for our 2020 construction spending and acquisitions of $1.6 billion and $950 million, respectively, and reflected a strong outlook for 2020, including continued strong demand for our value-creation development and redevelopment projects.
- Our guidance issued on April 27, 2020, reduced our 2020 forecasted construction spend, acquisitions, real estate dispositions and partial interest sales, and issuance of common equity. These reductions were deemed necessary while we monitored the impact of COVID-19 on many areas of our business, including the overall macro and capital market environments.
- Our guidance issued on July 27, 2020, was updated to address the continuing tenant demand for our development and redevelopment pipeline in part due to COVID-19 requirements, as well as existing and anticipated attractive acquisition opportunities in our markets, which will be partially funded through forecasted real estate dispositions and partial interest sales. Key updates to our sources and uses include:
- Increased midpoint for our 2020 construction spending guidance range from $960.0 million to $1.35 billion.
- An additional $900 million to $1.3 billion of real estate acquisitions in 2H20, including acquisitions completed in July 2020.
- Increased midpoint of our real estate dispositions and partial interest sales from $50.0 million to $1.25 billion, which is expected to fund a portion of the increase in construction spending and acquisitions in addition to providing significant capital for growth over the next two to three quarters.
- See "Key capital events" on page 3 for additional details on our July 2020 forward equity offering.
- See "Guidance" on page 10 for detailed assumptions for our updated guidance.
2020 Nareit Gold Investor CARE Award winner
2020 recipient of the Nareit Gold Investor CARE (Communications and Reporting Excellence) Award in the Large Cap Equity REIT category as the best-in-class REIT that delivers transparent, quality, and efficient communications and reporting to the investment community; our fifth Nareit Gold Investor CARE Award over the last six years, and our third consecutive Gold Award.
Core operating metrics
Continued strong net operating income and internal growth
- Net operating income ("NOI") (cash basis) of $1.1 billion for 2Q20 annualized, up $165.0 million, or 17.6%, compared to 2Q19 annualized.
- 94% of our leases contain contractual annual rent escalations approximating 3.0%.
- Same property net operating income growth:
- 1.6% and 4.5% (cash basis) for 1H20 over 1H19.
- 0.6% and 2.5% (cash basis) for 2Q20 over 2Q19.
- Includes the effect of temporary reduction in same property occupancy of 80 basis points related to downtime in connection with leases aggregating 152,045 RSF, with 63% already leased for delivery in the third quarter of 2020 at significantly higher rental rates. Excluding the impact of the temporary vacancies, the same property net operating income growth for the three months ended June 30, 2020, would have been 1.6% and 4.2% (cash basis), respectively. We expect occupancy and other contractual rental increases in the second half of 2020 will increase same property NOI and same property NOI (cash basis) to within our guidance range for the year ending December 31, 2020.
- Minimal remaining 2020 contractual lease expirations, aggregating 2.3% of annual rental revenue.
Highly leased value-creation pipeline, including COVID-19-focused R&D space
- Current projects aggregating 3.3 million RSF, including COVID-19-focused R&D spaces, are highly leased at 61% and will generate significant revenues and cash flows.
- As of July 27, 2020, construction activities were in process at all of our active value-creation projects.
- Significant pre-leasing at two new value-creation projects in our Sorrento Mesa submarket:
- Near-term development project at SD Tech by Alexandria, aggregating 176,428 RSF, is 59% pre-leased; and
- Active redevelopment project at 9877 Waples Street, a recently acquired property aggregating 63,774 RSF, is 100% pre-leased.
- Annual net operating income (cash basis), including our share of unconsolidated real estate joint ventures, is expected to increase $29 million upon the burn-off of initial free rent on recently delivered projects.
Strategic acquisitions with significant value-creation opportunities in key submarkets
- During 2Q20, we completed the acquisition of four properties aggregating 1.6 million RSF, including 1.4 million RSF of future value-creation opportunities and 63,774 RSF currently undergoing redevelopment, for an aggregate purchase price of $215.3 million. Refer to "Acquisitions" of this Earnings Press Release for additional details.
Balance sheet management
Key metrics as of June 30, 2020
- $27.7 billion of total market capitalization.
- $20.2 billion of total equity capitalization.
- $4.2 billion of liquidity as of June 30, 2020, pro forma for our $1.1 billion forward equity sales agreements entered into in July 2020.
|
|
2Q20
|
|
Goal
|
|
|
Quarter
|
|
Trailing
|
|
4Q20
|
|
|
Annualized
|
|
12 Months
|
|
Annualized
|
|
Net debt and preferred stock to
Adjusted EBITDA
|
|
5.8x
|
|
6.2x
|
|
Less than or equal to 5.3x
|
|
Fixed-charge coverage ratio
|
|
4.2x
|
|
4.2x
|
|
Greater than or equal to 4.4x
|
|
|
|
|
|
|
|
|
|
|
|
|
|
|
|
|
|
|
|
Value-creation pipeline of new Class A development and redevelopment projects as
a percentage of gross investments in real estate
|
|
2Q20
|
|
Current projects 65% leased/negotiating
|
|
7%
|
|
Income-producing/potential cash flows/covered land play(1)
|
|
6%
|
|
Land
|
|
2%
|
|
|
|
|
(1)
|
Includes projects that have existing buildings that are generating or can generate operating cash flows. Also includes development rights associated with existing operating campuses.
|
Key capital events
- In April 2020, we closed an additional unsecured senior line of credit with $750.0 million of available commitments. The new unsecured senior line of credit matures on April 14, 2022, and bears interest at LIBOR plus 1.05%. Pursuant to the terms of the agreement, we are required to repay the facility, if applicable, and reduce commitments available upon receiving the net proceeds from certain qualifying events, including new corporate debt and 50% of proceeds from the issuance of common stock, including any net proceeds from the settlement of our July 2020 forward equity sales agreements. Including our existing $2.2 billion unsecured senior line of credit, we have $2.95 billion in aggregate commitments under our unsecured senior lines of credit as of June 30, 2020.
- In 2020, we entered into forward equity sales agreements to sell an aggregate 13.8 million shares of our common stock (including the exercise of an underwriters' option). As of July 27, 2020, our outstanding forward equity agreements are as follows:
|
|
|
|
|
Public
|
|
Shares
(in thousands)
|
|
Net Proceeds
(in thousands)
|
|
|
|
Date
|
|
Offering Price
|
|
Settled
|
|
Outstanding
|
|
Received
|
|
Remaining
|
|
|
|
January 2020
|
|
$
|
155.00
|
|
3,356
|
|
3,544
|
|
$
|
500,001
|
|
$
|
519,621
|
|
|
|
July 2020
|
|
$
|
160.50
|
|
—
|
|
6,900
|
|
—
|
|
1,061,952
|
|
|
|
|
|
|
|
3,356
|
|
10,444
|
|
$
|
500,001
|
|
$
|
1,581,573
|
|
|
|
|
|
|
|
|
|
|
|
|
|
|
- During the three months ended June 30, 2020 and through July 27, 2020, there was no sale activity under our "at-the-market" common stock offering program ("ATM program"). As of July 27, 2020, we have $843.7 million remaining available under our ATM program.
Investments
- Our investments in publicly traded companies and privately held entities aggregated a carrying amount of $1.3 billion, including an adjusted cost basis of $762.3 million and unrealized gains of $556.2 million, as of June 30, 2020.
- Investment income included $184.7 million during 2Q20, comprising $17.7 million in realized gains, $4.7 million in impairments related to privately held non-real estate investments, and $171.7 million in unrealized gains.
Leader in corporate responsibility: philanthropic activities and partnerships to positively impact our communities
At the vanguard of fighting COVID-19 by aiding communities adversely affected by the global pandemic
- Alexandria has sourced and donated over 54,000 pieces of much-needed personal protective equipment to 12 hospitals and other entities in need in New York City, Boston, Seattle, San Diego, Dayton, and Los Angeles for use by medical professionals working on the front lines of the COVID-19 response. Through strategic philanthropic giving and the Company's matching gift programs, Alexandria donated, in aggregate, over $700,000 to several highly impactful national and regional organizations performing important work to support a myriad of efforts in communities affected by this global public health emergency, including the following:
-
Feeding America – COVID-19 Response Fund, the fund from the nation's largest hunger-relief organization with a network of 200 member food banks, is supporting the food banks that help people feed their families during the school closures, job disruptions, and health risks related to the COVID-19 pandemic.
-
First Responders Children's Foundation COVID-19 Emergency Response Fund is providing support to the families of first responders on the front lines of the COVID-19 pandemic, who are enduring financial hardship due to the outbreak.
-
Robin Hood's COVID-19 Relief Fund, from New York City's largest poverty-fighting organization, is providing immediate, short-term grants to support non-profits that are on the front lines in the fight against COVID-19 so they can move swiftly to serve affected communities.
-
Relief Opportunities for All Restaurants (ROAR) is providing financial relief directly to employees of restaurants who have lost their jobs as a result of the COVID-19 pandemic.
-
City of Cambridge Disaster Fund for COVID-19 is providing emergency assistance in partnership with non-profit organizations to individuals and families in Cambridge experiencing extreme financial hardship caused by the COVID-19 crisis.
-
Project Angel Food is committed to providing uninterrupted deliveries of nutritious medically tailored meals to people impacted by serious illness in the Los Angeles area throughout the duration of the COVID-19 pandemic.
Driving educational opportunity and providing resources to underserved communities
- We regard education as one of the most fundamental foundations to achieving a safe, healthy, and good life. As a result, we have forged deep partnerships with inspiring community organizations focused on providing educational resources to underserved communities in a multitude of ways. Working closely with these organizations, we have helped open the doors of opportunity for countless students.
- During 2Q20, we announced Alexandria's 2020 scholarship recipients, 11 high-achieving public school students in San Francisco and Maryland who will each receive $5,000 annually to attend either a two- or four-year program at a college/university of their choice to study one of the STEM (science, technology, engineering, and mathematics) fields.
- As both a founding and sustaining donor, we have been passionate longtime supporters of Computer Science for All (CS4ALL) — a 10-year initiative launched in 2015 to provide high-quality computer science education for New York City's 1.1 million public school students. Alexandria volunteers have worked alongside NYC high school students to rebuild computers donated by Alexandria for use in the CS4ALL program; served as judges for CS4ALL's Hack League, a citywide coding competition involving students from 62 middle and high schools across New York City; participated in multiple Computer Science Education Weeks, a global effort encouraging computer science education; and hosted CS4ALL students at the Alexandria Center® for Life Science – NYC for them to learn about the vast array of jobs that computer science touches and the career paths available to them. Our ongoing partnership with CS4ALL has helped ensure that NYC's public school students have the skills they need to achieve success in higher education, the 21st-century job market, and beyond.
- Through our very hands-on work with, and mission-critical funding support for, the Emily Krzyzewski Center in Durham, North Carolina, we are helping propel academically focused, low-income K–12 students and graduates toward success in college. Emily K programs begin in elementary and middle school to build and accelerate academic skills that lay the foundation for future college success. As students move on to high school, they receive holistic support in the areas of college planning, personal management and leadership, academic skills development, and career exploration, leading to graduating seniors who are scholarship eligible and college ready. After 12 years, the success rate for admittance to a four-year college is 100%.
-
Robin Hood, New York City's largest poverty fighting organization, has an intense focus on education and works to ensure that low-income students at risk of not finishing high school graduate ready to succeed in college and career. Robin Hood has provided over $29 million in funding to impactful tutoring and mentorship programs, college prep programs, mental health and counseling services, and teacher training initiatives and has helped more than 55,000 students across the city last year alone. We have very actively worked with CEO Wes Moore, as well as offered significant financial support, to make a huge impact in the underserved communities of New York City through highly important programs that have measurable outcomes.
- Alexandria has worked closely with Breakthrough Greater Boston (BTGB) over many years to prepare low-income students for success in college and train the next generation of urban teachers. Through six years of intensive, tuition-free, out-of-school-time programming, BTGB changes students' academic trajectories and supports them along the path to college. Students gain a passion for learning and the perseverance and tools needed to succeed in college and beyond. BTGB also works to build the next generation of teachers through competitive recruitment, research-based training, and coaching from master teachers. Teaching Fellows gain intensive in-classroom experience, expert training, and 1:1 coaching.
Pioneering a uniquely comprehensive care model to tackle opioid addiction
- Against the backdrop of the COVID-19 pandemic, the U.S. opioid epidemic remains one of the most devastating public health issues of our time. With many people confronting additional stresses such as isolation, unemployment, anxiety, and loss, monthly drug overdose deaths, which decreased in 2018 for the first time in 25 years, have skyrocketed to record numbers during the pandemic, up 42% in May 2020 relative to May 2019. This alarming spike in drug overdoses highlights the urgent unmet need for evidence-based holistic treatment systems for addiction.
- As a key component of Alexandria's mission to advance human health, we partnered with Verily, an Alphabet company, to pioneer a comprehensive care model for the full and sustained recovery of people suffering from opioid addiction. The 59,000 RSF campus, situated on 4.3 acres in Dayton, Ohio, includes dedicated facilities and services for treatment, residential housing, group therapy, family reunification, fitness, workforce development programs, job placement, and community transition. Alexandria has led the design and development of the campus, which opened to patients in the fall of 2019. In July 2020, we completed OneFifteen Living, the campus's three-story residential facility designed to serve as a safe place for individuals suffering from opioid addiction to live while accessing on-campus treatment services.
- As overdose deaths in 1H20 are up 34% compared to 1H19 in Montgomery County, Ohio, where our state-of-the-art OneFifteen campus is located, OneFifteen's doors are open to those ready to make a change and it has also successfully ramped up telehealth services to ensure those needing its addiction services do not experience a gap in care during this critical time. It is our sincerest hope that OneFifteen will not only provide hope for the Dayton community, but that is also serves as a blueprint for rest of the country.
Industry and ESG leadership
- In June 2020, our executive chairman and founder, Joel S. Marcus, had the honor of serving as the keynote speaker for a special fireside chat at the virtual BIO Health Caucus hosted by the Association of University Research Parks, an organization dedicated to guiding leaders to cultivate communities of innovation at global anchor institutions. The virtual fireside, titled "Three Decades of Building Bio Health Facilities and Companies," covered a broad array of topics that provided a comprehensive view of our essential business, our dynamic cluster locations, and our critical role at the vanguard of the life science ecosystem fighting COVID-19.
- In June 2020, we released our 2019 Corporate Responsibility Report, which reinforces Alexandria's longstanding environmental, social, and governance commitment, strong progress toward our 2025 environmental impact goals, and critical role at the vanguard of the life science ecosystem advancing solutions for COVID-19.
- In June 2020, we announced that Alexandria LaunchLabs® – AgTech awarded its inaugural $100,000 AgTech Innovation Prize to TerMir Inc., an early-stage agtech company aiming to address key, unresolved agricultural, environmental, and human health challenges.
|
(1)
|
Represents an illustrative subset of over 80 tenants focused on COVID-19-related efforts, with some of these companies working on multiple efforts that span testing, treatment, and/or vaccine development.
|
|
(1)
|
Source: FierceBiotech, "NIAID creates new COVID-19 drug and vaccine trial network through Trump's Warp Speed program," July 9, 2020.
|
|
(2)
|
Announced award value and clinical trial stage as of July 24, 2020.
|
Alexandria Fighting COVID-19 on Multiple Fronts
June 30, 2020
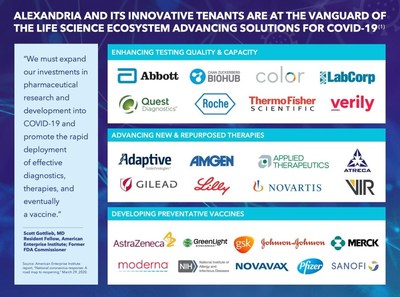
Alexandria and its innovative tenants are at the vanguard of the life science ecosystem advancing solutions for COVID-19
Safe and effective vaccines and therapies, in addition to widespread testing, are desperately needed to combat the global COVID-19 pandemic. By maintaining essential business operations across our campuses, Alexandria has enabled several of our life science tenants to continue mission-critical COVID-19-related research and development. The heroic work being done by so many of our tenants and campus community members to help test for, treat, and prevent COVID-19, as well as provide medical supplies and protective equipment to neighboring hospitals, is profound and inspiring. We are currently tracking over 80 tenants across our cluster markets who are advancing solutions for COVID-19.
Developing preventative vaccines
A prophylactic vaccine should help bring about the effective end of the global COVID-19 pandemic. As such, researchers around the world are developing over 165 vaccines against the coronavirus, with at least 27 vaccine candidates in human trials.
In an effort to expedite the development, manufacturing, and distribution of COVID-19 vaccines, the U.S. government has allocated $10 billion to its Operation Warp Speed (OWS) initiative, calling for unprecedented public-private collaboration. OWS has awarded grants to a handful of company partners to date, including tenants AstraZeneca plc, Emergent BioSolutions Inc., Johnson & Johnson, Moderna, Inc., Novavax, Inc., and Pfizer Inc. Clinical trial data will continue to be reported by each company over the coming months, and the first COVID-19 vaccine could receive emergency use authorization from the FDA by year-end 2020 or early 2021.
Other tenants, including GlaxoSmithKline, GreenLight Biosciences, Inc., Medicago Inc., Merck & Co., Inc., and Sanofi, are similarly leveraging their vaccine development expertise and technology platforms to bring vaccine candidates into clinical trials, with the goal of expediting the delivery of a safe and effective vaccine to the public within the next 12 months.
Advancing new and repurposed therapies
Over 350 experimental drug treatments are being studied in over 500 clinical trials around the world in addition to more than 250 therapeutic candidates in preclinical development. A substantial number of these programs are sponsored by our tenants, including the following notable efforts:
-
Eli Lilly and Company, in collaboration with AbCellera, began its Phase I study ahead of schedule to test a novel antibody targeted against the SARS-CoV-2 virus, the first COVID-19-specific antibody program of its kind to enter the clinic.
-
Gilead Sciences, Inc.'s remdesivir is in late-stage studies for the treatment of moderate and severe COVID-19 patients. Based on positive safety and efficacy data, the FDA granted emergency use authorization for remdesivir in the treatment of hospitalized patients with severe COVID-19.
-
Adaptive Biotechnologies Corporation and Amgen are working together to identify and develop therapeutic antibodies from the blood of patients who are actively fighting or have recently recovered from COVID-19.
-
Vir Biotechnology, Inc. has announced unique partnerships with Alnylam Pharmaceuticals, Inc. and GlaxoSmithKline to utilize its neutralizing antibody platform to identify novel drug candidates that could be used as therapeutic or preventative COVID-19 treatments.
Many other Alexandria tenants, including AbbVie Inc., Atreca Inc., Corvus Pharmaceuticals, Inc., Enanta Pharmaceuticals, Inc., Novartis AG, and Pfizer Inc., are similarly endeavoring to develop novel therapies and repurpose existing and investigational drugs to provide near-term treatments for moderate and severe COVID-19 patients and those at highest risk.
Improving testing quality and capacity
Color Genomics, Laboratory Corporation of America Holdings, Quest Diagnostics, Roche, Thermo Fisher Scientific Inc., Verily Life Sciences, and others are working to improve testing quality, capacity, and turnaround time to more effectively determine who has an active COVID-19 infection, who has been exposed to the virus, and who has developed immunity against it. The increased availability of widespread COVID-19 testing is critical for curtailing the pandemic and facilitating a safer reopening of workplaces, communities, and society overall.
|
Acquisitions
June 30, 2020
(Dollars in thousands)
|
|
|
|
|
|
|
|
|
|
|
|
|
|
|
|
|
|
|
|
|
|
|
|
|
Square Footage
|
|
Unlevered Yields
|
|
|
|
Property
|
|
Submarket/Market
|
|
Date of
Purchase
|
|
Number of
Properties
|
|
Operating
Occupancy
|
|
Future
Development
|
|
Active
Redevelopment
|
|
Operating With
Future
Development/
Redevelopment
|
|
Operating
|
|
Initial
Stabilized
|
|
Initial
Stabilized
(Cash)
|
|
Purchase Price
|
|
|
|
|
|
|
|
|
|
|
|
|
|
|
|
|
|
|
|
|
|
|
|
|
|
|
|
|
|
Completed in 1Q20
|
|
|
|
|
|
11
|
|
79%
|
|
295,000
|
|
—
|
|
371,031
|
|
1,492,599
|
|
|
|
|
|
$
|
484,579
|
|
|
|
|
|
|
|
|
|
|
|
|
|
|
|
|
|
|
|
|
|
|
|
|
|
|
|
|
|
Completed in 2Q20:
|
|
|
|
|
|
|
|
|
|
|
|
|
|
|
|
|
|
|
|
|
|
|
|
|
|
|
|
987 and 1075 Commercial
Street
|
|
Greater Stanford/
San Francisco
|
|
4/14/20
|
|
2
|
|
100%
|
|
700,000
|
(1)
|
—
|
|
26,738
|
|
—
|
|
(2)
|
|
(2)
|
|
|
113,250
|
|
|
4555 Executive Drive
|
|
University Town
Center/San Diego
|
|
6/2/20
|
|
1
|
|
100%
|
|
200,000
|
(1)
|
—
|
|
41,475
|
|
—
|
|
(2)
|
|
(2)
|
|
|
43,000
|
|
|
Other
|
|
Various
|
|
Various
|
|
1
|
|
N/A
|
|
544,825
|
|
63,774
|
|
—
|
|
—
|
|
N/A
|
|
N/A
|
|
|
59,000
|
|
|
|
|
|
|
|
4
|
|
100%
|
|
1,444,825
|
|
63,774
|
|
68,213
|
|
—
|
|
|
|
|
|
|
|
|
215,250
|
|
|
|
|
|
|
|
|
|
|
|
|
|
|
|
|
|
|
|
|
|
|
|
|
|
|
|
|
|
Completed in July 2020:
|
|
|
|
|
|
|
|
|
|
|
|
|
|
|
|
|
|
|
|
|
|
|
|
|
|
|
|
Various
|
|
Various
|
|
Various(3)
|
|
3
|
|
Various
|
|
567,488
|
|
—
|
|
181,515
|
|
—
|
|
N/A
|
|
N/A
|
|
|
141,744
|
|
|
Pending acquisitions:
|
|
|
|
|
|
|
|
|
|
|
|
|
|
|
|
|
|
|
|
|
|
|
|
|
|
|
|
Pending
|
|
Greater Boston
|
|
TBD
|
|
2
|
|
100%
|
|
400,000
|
|
—
|
|
200,000
|
|
300,000
|
|
|
|
|
|
|
|
|
330,000
|
|
|
Other
|
|
Various
|
|
TBD
|
|
|
|
|
|
|
|
|
|
|
|
|
|
|
|
|
|
|
|
780,000
|
|
|
2020 guidance range
|
|
|
|
|
|
|
|
|
|
|
|
|
|
|
|
|
|
|
|
|
|
$1,600,000 - $2,000,000
|
|
|
|
|
|
|
|
|
|
|
|
|
|
|
|
|
|
|
|
|
|
|
|
|
|
|
|
|
|
Mercer Mega Block
|
|
Lake Union/Seattle
|
|
TBD(4)
|
|
—
|
|
N/A
|
|
800,000
|
|
—
|
|
—
|
|
—
|
|
(3)
|
|
(3)
|
|
$
|
143,500
|
|
|
|
|
|
|
|
|
|
|
|
|
|
|
|
|
|
|
|
|
|
|
|
|
|
|
|
|
|
(1)
|
Represents total square footage upon completion of development or redevelopment of a new Class A property. Square footage presented includes RSF of buildings currently in operation. We intend to demolish the existing property upon expiration of the existing in-place leases and commencement of future construction. Refer to "Definitions and reconciliations" of this Supplemental Information for additional details on value-creation square feet currently included in rental properties.
|
|
(2)
|
We expect to provide total estimated costs and related yields for development and redevelopment projects in the future, subsequent to the commencement of construction.
|
|
(3)
|
Includes three properties acquired through three transactions.
|
|
(4)
|
We are diligently working through various long-lead time due diligence items, with certain deadlines extending into early 2021. We are working toward completion of all due diligence items as soon as possible.
|
Guidance
June 30, 2020
(Dollars in millions, except per share amounts)
Our initial 2020 guidance issued on December 3, 2019, included ranges for 2020 construction spending and acquisitions of $1.55 billion to $1.65 billion and $900 million to $1.0 billion, respectively, and reflected a strong outlook for 2020, including continued strong demand for our value-creation development and redevelopment projects. Our guidance issued on April 27, 2020 reduced our 2020 forecasted construction spend, acquisitions, real estate dispositions and partial interest sales, and issuance of common equity. These reductions were deemed necessary while we monitored the impact of COVID-19 on many areas of our business, including the overall macro and capital market environments.
The following provides key updates to our 2020 guidance since April 27, 2020, based on our current view of existing market conditions and other assumptions for the year ending December 31, 2020, and reflects increases in uses of capital to address the continuing tenant demand for our development and redevelopment pipeline and existing and anticipated attractive acquisition opportunities. Our updated 2020 construction spending guidance range increased closer to our initial forecast for 2020. Additionally, our initial guidance for 2020 anticipated meaningful acquisitions opportunities and our updated 2020 acquisition guidance range continues to reflect opportunistic offerings in the market with an increase above our initial acquisition guidance range to be funded through forecasted real estate dispositions and partial interest sales. Proceeds from these forecasted sales are expected to fund a portion of the increase in construction spending and acquisitions, in addition to providing significant capital for growth over the next two to three quarters. We remain committed to our guidance for net debt and preferred stock to Adjusted EBITDA – fourth quarter of 2020, annualized, of less than or equal to 5.3x. There can be no assurance that actual amounts will not be materially higher or lower than these expectations. Also, refer to our discussion of "forward-looking statements" on page 12 of this Earnings Press Release for additional details.
|
Projected 2020 Earnings per Share and Funds From Operations per Share Attributable to Alexandria's Common Stockholders – Diluted
|
|
|
As of 7/27/20
|
|
|
As of 4/27/20
|
|
Earnings per share(1)
|
|
$3.00 to $3.08
|
|
|
$1.69 to $1.79
|
|
Depreciation and amortization of real estate assets
|
|
5.15
|
|
|
5.15
|
|
Impairment of real estate – rental properties(2)
|
|
0.06
|
|
|
0.06
|
|
Allocation to unvested restricted stock awards
|
|
(0.05)
|
|
|
(0.04)
|
|
Funds from operations per share
|
|
$8.16 to $8.24
|
|
|
$6.86 to $6.96
|
|
Unrealized (gains) losses on non-real estate investments
|
|
(1.25)
|
|
|
0.14
|
|
Impairment of non-real estate investments
|
|
0.20
|
|
|
0.16
|
|
Impairment of real estate(3)
|
|
0.12
|
|
|
0.10
|
|
Allocation to unvested restricted stock awards
|
|
0.01
|
|
|
(0.01)
|
|
Other
|
|
0.02
|
|
|
—
|
|
Funds from operations per share, as adjusted(1)
|
|
$7.26 to $7.34
|
|
|
$7.25 to $7.35
|
|
Midpoint
|
|
$7.30
|
|
|
$7.30
|
|
|
|
|
|
|
|
|
|
As of 7/27/20
|
|
As of 4/27/20
|
|
Key Assumptions
|
|
Low
|
|
High
|
|
Low
|
|
High
|
|
Occupancy percentage in North America as of December 31, 2020
|
|
94.8%
|
|
95.4%
|
|
94.8%
|
|
95.4%
|
|
Lease renewals and re-leasing of space:
|
|
|
|
|
|
|
|
|
|
Rental rate increases
|
|
28.0%
|
|
31.0%
|
|
28.0%
|
|
31.0%
|
|
Rental rate increases (cash basis)
|
|
14.0%
|
|
17.0%
|
|
14.0%
|
|
17.0%
|
|
Same property performance:
|
|
|
|
|
|
|
|
|
|
Net operating income increase
|
|
1.0%
|
|
3.0%
|
|
1.0%
|
|
3.0%
|
|
Net operating income increase (cash basis)
|
|
4.5%
|
|
6.5%
|
|
4.5%
|
|
6.5%
|
|
Straight-line rent revenue
|
|
$
|
98
|
|
$
|
108
|
|
$
|
98
|
|
$
|
108
|
|
General and administrative expenses
|
|
$
|
121
|
|
$
|
126
|
|
$
|
121
|
|
$
|
126
|
|
Capitalization of interest
|
|
$
|
117
|
|
$
|
127
|
|
$
|
102
|
|
$
|
112
|
|
Interest expense
|
|
$
|
170
|
|
$
|
180
|
|
$
|
185
|
|
$
|
195
|
|
|
|
|
|
|
|
|
|
|
|
|
|
|
|
|
|
|
|
(1)
|
Excludes unrealized gains or losses after June 30, 2020, that are required to be recognized in earnings and are excluded from funds from operations per share, as adjusted.
|
|
(2)
|
Includes a $7.6 million impairment on our investment in a recently developed retail property held by our unconsolidated real estate joint venture.
|
|
(3)
|
Includes eight cents related to an impairment charge of $10 million recognized in April 2020 to write off the carrying amount of the pre-acquisition deposit related to an operating tech office property for which our revised economic projections declined from our initial underwriting. The impairment was recognized concurrently with the submission of our notice to terminate the transaction.
|
|
Guidance
June 30, 2020
(Dollars in millions, except per share amounts)
|
|
|
Key Credit Metrics
|
|
2020 Guidance
|
|
Net debt and preferred stock to Adjusted EBITDA – 4Q20 annualized
|
|
Less than or equal to 5.3x
|
|
Fixed-charge coverage ratio – 4Q20 annualized
|
|
Greater than or equal to 4.4x
|
|
|
|
|
|
|
|
As of 7/27/20
|
|
|
|
|
|
|
Key Sources and Uses of Capital
|
|
Range
|
|
Midpoint
|
|
Certain
Completed
Items
|
|
As of 4/27/20
Midpoint
|
|
As of 2/3/20
Midpoint
|
|
|
Sources of capital:
|
|
|
|
|
|
|
|
|
|
|
|
|
|
|
|
|
Net cash provided by operating activities after dividends
|
|
$
|
185
|
|
$
|
225
|
|
$
|
205
|
|
|
|
|
$
|
205
|
|
$
|
220
|
|
|
Incremental debt
|
|
415
|
|
575
|
|
|
495
|
|
see below
|
|
335
|
|
380
|
|
|
Real estate dispositions and partial interest sales
|
|
1,000
|
|
1,500
|
|
|
1,250
|
|
$
|
51
|
(1)
|
|
50
|
(1)
|
50
|
(1)
|
|
Common equity
|
|
2,090
|
|
2,090
|
|
|
2,090
|
|
$
|
2,087
|
(2)
|
|
1,020
|
(1)
|
1,900
|
(1)
|
|
Total sources of capital
|
|
$
|
3,690
|
|
$
|
4,390
|
|
$
|
4,040
|
|
|
|
|
|
$
|
1,610
|
|
$
|
2,550
|
|
|
Uses of capital:
|
|
|
|
|
|
|
|
|
|
|
|
|
|
|
|
|
|
|
|
|
|
|
|
|
|
Construction (see page 44 for additional information)
|
|
$
|
1,200
|
|
$
|
1,500
|
|
$
|
1,350
|
|
|
|
|
$
|
960
|
|
$
|
1,600
|
|
|
Acquisitions (see page 8 for additional information)
|
|
1,600
|
|
2,000
|
|
|
1,800
|
|
$
|
842
|
|
|
650
|
|
950
|
|
|
Total uses of capital
|
|
$
|
2,800
|
|
$
|
3,500
|
|
$
|
3,150
|
|
|
|
|
$
|
1,610
|
|
$
|
2,550
|
|
|
Incremental debt (included above):
|
|
|
|
|
|
|
|
|
|
|
|
|
|
|
|
|
|
|
|
|
Issuance of unsecured senior notes payable(3)
|
|
$
|
700
|
|
$
|
700
|
|
$
|
700
|
|
$
|
700
|
|
|
$
|
700
|
|
$
|
600
|
|
|
$3.0 billion unsecured senior lines of credit and other
|
|
(285)
|
|
(125)
|
|
|
(205)
|
|
|
|
|
(365)
|
|
(220)
|
|
|
Incremental debt
|
|
$
|
415
|
|
$
|
575
|
|
$
|
495
|
|
|
|
|
$
|
335
|
|
$
|
380
|
|
|
|
|
|
|
|
|
|
|
|
|
|
|
|
|
|
|
Excess sources of capital
|
|
|
|
|
|
$
|
890
|
|
|
|
|
$
|
—
|
|
$
|
—
|
|
|
|
|
|
|
|
|
|
|
|
|
|
|
|
|
|
|
|
|
(1)
|
In April 2020, we completed the sale of a partial interest in properties at 9808 and 9868 Scranton Road in our Sorrento Mesa submarket to the existing SD Tech by Alexandria consolidated real estate joint venture, of which we own 50%. We received proceeds of $51.1 million for the 50% interest in the properties that our joint venture partner acquired through the joint venture. Our previous guidance disclosures included a combined amount for real estate dispositions, partial interest sales, and common equity. Amounts presented have been split into two separate categories for (i) actual real estate dispositions and partial interest sales completed through July 27, 2020, and (ii) common equity.
|
|
(2)
|
In January 2020 and July 2020, we completed $1.0 billion and $1.1 billion of forward equity sales agreements, respectively, to sell an aggregate of 6.9 million shares for each offering (13.8 million in aggregate) of our common stock (including the exercise of an underwriters' option) at a public offering price of $155.00 per share and $160.50 per share, respectively, before underwriting discounts. In March 2020, we settled 3.4 million shares from our forward equity sales agreements and received proceeds of $500.0 million. As of July 27, 2020, 10.4 million shares of our common stock remain outstanding under forward equity sales agreements, for which we expect to receive proceeds of $1.6 billion, to be further adjusted as provided in the sales agreements, that will fund pending and recently completed acquisitions and the construction of our highly leased development projects. We expect to settle the remaining outstanding forward equity sales agreements in 2020.
|
|
(3)
|
We may opportunistically seek to refinance additional near term maturities in 2020, subject to market conditions.
|
Earnings Call Information and About the Company
June 30, 2020
We will host a conference call on Tuesday, July 28, 2020, at 3:00 p.m. Eastern Time ("ET")/noon Pacific Time ("PT"), which is open to the general public, to discuss our financial and operating results for the second quarter ended June 30, 2020. To participate in this conference call, dial (833) 366-1125 or (412) 902-6738 shortly before 3:00 p.m. ET/noon PT and ask the operator to join the call for Alexandria Real Estate Equities, Inc. The audio webcast can be accessed at www.are.com in the "For Investors" section. A replay of the call will be available for a limited time from 5:00 p.m. ET/2:00 p.m. PT on Tuesday, July 28, 2020. The replay number is (877) 344-7529 or (412) 317-0088, and the access code is 10143904.
Additionally, a copy of this Earnings Press Release and Supplemental Information for the second quarter ended June 30, 2020, is available in the "For Investors" section of our website at www.are.com or by following this link: http://www.are.com/fs/2020q2.pdf.
For any questions, please contact Joel S. Marcus, executive chairman and founder; Stephen A. Richardson, co-chief executive officer; Peter M. Moglia, co-chief executive officer and co-chief investment officer; Dean A. Shigenaga, co-president and chief financial officer; or Sara M. Kabakoff, vice president – corporate communications, at (626) 578-0777; or Paula Schwartz, managing director of Rx Communications Group, at (917) 322-2216.
About the Company
Alexandria Real Estate Equities, Inc. (NYSE:ARE), an S&P 500® urban office real estate investment trust ("REIT"), is the first, longest-tenured, and pioneering owner, operator, and developer uniquely focused on collaborative life science, technology, and agtech campuses in AAA innovation cluster locations, with a total market capitalization of $27.7 billion as of June 30, 2020, and an asset base in North America of 43.0 million square feet ("SF"). The asset base in North America includes 28.8 million RSF of operating properties and 2.3 million RSF of Class A properties undergoing construction, 6.6 million RSF of near-term and intermediate-term development and redevelopment projects, and 5.3 million SF of future development projects. Founded in 1994, Alexandria pioneered this niche and has since established a significant market presence in key locations, including Greater Boston, San Francisco, New York City, San Diego, Seattle, Maryland, and Research Triangle. Alexandria has a longstanding and proven track record of developing Class A properties clustered in urban life science, technology, and agtech campuses that provide our innovative tenants with highly dynamic and collaborative environments that enhance their ability to successfully recruit and retain world-class talent and inspire productivity, efficiency, creativity, and success. Alexandria also provides strategic capital to transformative life science, technology, and agtech companies through our venture capital arm. We believe our unique business model and diligent underwriting ensure a high-quality and diverse tenant base that results in higher occupancy levels, longer lease terms, higher rental income, higher returns, and greater long-term asset value. For additional information on Alexandria, please visit www.are.com.
***********
This document includes "forward-looking statements" within the meaning of Section 27A of the Securities Act of 1933, as amended, and Section 21E of the Securities Exchange Act of 1934, as amended. Such forward-looking statements include, without limitation, statements regarding our 2020 earnings per share attributable to Alexandria's common stockholders – diluted, 2020 funds from operations per share attributable to Alexandria's common stockholders – diluted, net operating income, and our projected sources and uses of capital. You can identify the forward-looking statements by their use of forward-looking words, such as "forecast," "guidance," "goals," "projects," "estimates," "anticipates," "believes," "expects," "intends," "may," "plans," "seeks," "should," or "will," or the negative of those words or similar words. These forward-looking statements are based on our current expectations, beliefs, projections, future plans and strategies, anticipated events or trends, and similar expressions concerning matters that are not historical facts, as well as a number of assumptions concerning future events. There can be no assurance that actual results will not be materially higher or lower than these expectations. These statements are subject to risks, uncertainties, assumptions, and other important factors that could cause actual results to differ materially from the results discussed in the forward-looking statements. Factors that might cause such a difference include, without limitation, our failure to obtain capital (debt, construction financing, and/or equity) or refinance debt maturities, increased interest rates and operating costs, adverse economic or real estate developments in our markets (including the impact of the ongoing COVID-19 pandemic), our failure to successfully place into service and lease any properties undergoing development or redevelopment and our existing space held for future development or redevelopment (including new properties acquired for that purpose), our failure to successfully operate or lease acquired properties, decreased rental rates, increased vacancy rates or failure to renew or replace expiring leases, defaults on or non-renewal of leases by tenants, adverse general and local economic conditions, an unfavorable capital market environment, decreased leasing activity or lease renewals, and other risks and uncertainties detailed in our filings with the Securities and Exchange Commission ("SEC"). Accordingly, you are cautioned not to place undue reliance on such forward-looking statements. All forward-looking statements are made as of the date of this Earnings Press Release, and unless otherwise stated, we assume no obligation to update this information and expressly disclaim any obligation to update or revise any forward-looking statements, whether as a result of new information, future events, or otherwise. For more discussion relating to risks and uncertainties that could cause actual results to differ materially from those anticipated in our forward-looking statements, and risks to our business in general, please refer to our SEC filings, including our most recent annual report on Form 10-K and any subsequent quarterly reports on Form 10-Q.
For additional discussion of the risks and other potential impacts posed by the outbreak of the COVID-19 pandemic and uncertainties we, our tenants, and the global and national economies face as a result, see the sections entitled "Risk Factors" and "Management's Discussion and Analysis of Financial Condition and Results of Operations" in our quarterly report on Form 10-Q filed with the SEC on July 27, 2020.
Alexandria®, Lighthouse Design® logo, Building the Future of Life-Changing Innovation™, Alexandria Center®, Alexandria Technology Square®, Alexandria Summit®, Alexandria Technology Center®, Alexandria Innovation Center®, LaunchLabs®, and GradLabs™ are trademarks of Alexandria Real Estate Equities, Inc. All other company names, trademarks, and logos referenced herein are the property of their respective owners.
|
Consolidated Statements of Operations
June 30, 2020
(Dollars in thousands, except per share amounts)
|
|
|
|
Three Months Ended
|
|
Six Months Ended
|
|
|
6/30/20
|
|
3/31/20
|
|
12/31/19
|
|
9/30/19
|
|
6/30/19
|
|
6/30/20
|
|
6/30/19
|
|
Revenues:
|
|
|
|
|
|
|
|
|
|
|
|
|
|
|
|
Income from rentals
|
|
$
|
435,856
|
(1)
|
|
$
|
437,605
|
|
|
$
|
404,721
|
|
|
$
|
385,776
|
|
|
$
|
371,618
|
|
|
$
|
873,461
|
|
|
$
|
726,367
|
|
|
Other income
|
|
1,100
|
|
|
2,314
|
|
|
3,393
|
|
|
4,708
|
|
|
2,238
|
|
|
3,414
|
|
|
6,331
|
|
|
Total revenues
|
|
436,956
|
|
|
439,919
|
|
|
408,114
|
|
|
390,484
|
|
|
373,856
|
|
|
876,875
|
|
|
732,698
|
|
|
|
|
|
|
|
|
|
|
|
|
|
|
|
|
|
Expenses:
|
|
|
|
|
|
|
|
|
|
|
|
|
|
|
|
Rental operations
|
|
123,911
|
|
|
129,103
|
|
|
121,852
|
|
|
116,450
|
|
|
105,689
|
|
|
253,014
|
|
|
207,190
|
|
|
General and administrative
|
|
31,775
|
|
|
31,963
|
|
|
29,782
|
|
|
27,930
|
|
|
26,434
|
|
|
63,738
|
|
|
51,111
|
|
|
Interest
|
|
45,014
|
|
|
45,739
|
|
|
45,493
|
|
|
46,203
|
|
|
42,879
|
|
|
90,753
|
|
|
81,979
|
|
|
Depreciation and amortization
|
|
168,027
|
|
|
175,496
|
|
|
140,518
|
|
|
135,570
|
|
|
134,437
|
|
|
343,523
|
|
|
268,524
|
|
|
Impairment of real estate
|
|
13,218
|
(2)
|
|
2,003
|
|
|
12,334
|
|
|
—
|
|
|
—
|
|
|
15,221
|
|
|
—
|
|
|
Loss on early extinguishment of debt
|
|
—
|
|
|
—
|
|
|
—
|
|
|
40,209
|
|
|
—
|
|
|
—
|
|
|
7,361
|
|
|
Total expenses
|
|
381,945
|
|
|
384,304
|
|
|
349,979
|
|
|
366,362
|
|
|
309,439
|
|
|
766,249
|
|
|
616,165
|
|
|
|
|
|
|
|
|
|
|
|
|
|
|
|
|
|
Equity in earnings (losses) of unconsolidated real estate joint ventures
|
|
3,893
|
|
|
(3,116)
|
|
|
4,777
|
|
|
2,951
|
|
|
1,262
|
|
|
777
|
|
|
2,408
|
|
|
Investment income (loss)
|
|
184,657
|
|
|
(21,821)
|
|
|
152,667
|
|
|
(63,076)
|
|
|
21,500
|
|
|
162,836
|
|
|
105,056
|
|
|
Gain on sales of real estate
|
|
—
|
|
|
—
|
|
|
474
|
|
|
—
|
|
|
—
|
|
|
—
|
|
|
—
|
|
|
Net income (loss)
|
|
243,561
|
|
|
30,678
|
|
|
216,053
|
|
|
(36,003)
|
|
|
87,179
|
|
|
274,239
|
|
|
223,997
|
|
|
Net income attributable to noncontrolling interests
|
|
(13,907)
|
|
|
(11,913)
|
|
|
(13,612)
|
|
|
(11,199)
|
|
|
(8,412)
|
|
|
(25,820)
|
|
|
(16,071)
|
|
|
Net income (loss) attributable to Alexandria Real Estate Equities, Inc.'s
stockholders
|
|
229,654
|
|
|
18,765
|
|
|
202,441
|
|
|
(47,202)
|
|
|
78,767
|
|
|
248,419
|
|
|
207,926
|
|
|
Dividends on preferred stock
|
|
—
|
|
|
—
|
|
|
—
|
|
|
(1,173)
|
|
|
(1,005)
|
|
|
—
|
|
|
(2,031)
|
|
|
Preferred stock redemption charge
|
|
—
|
|
|
—
|
|
|
—
|
|
|
—
|
|
|
—
|
|
|
—
|
|
|
(2,580)
|
|
|
Net income attributable to unvested restricted stock awards
|
|
(3,054)
|
|
|
(1,925)
|
|
|
(2,823)
|
|
|
(1,398)
|
|
|
(1,432)
|
|
|
(3,574)
|
|
|
(3,134)
|
|
|
Net income (loss) attributable to Alexandria Real Estate Equities, Inc.'s
common stockholders
|
|
$
|
226,600
|
|
|
$
|
16,840
|
|
|
$
|
199,618
|
|
|
$
|
(49,773)
|
|
|
$
|
76,330
|
|
|
$
|
244,845
|
|
|
$
|
200,181
|
|
|
|
|
|
|
|
|
|
|
|
|
|
|
|
|
|
Net income (loss) per share attributable to Alexandria Real Estate Equities,
Inc.'s common stockholders:
|
|
|
|
|
|
|
|
|
|
|
|
|
|
|
|
Basic
|
|
$
|
1.82
|
|
|
$
|
0.14
|
|
|
$
|
1.75
|
|
|
$
|
(0.44)
|
|
|
$
|
0.68
|
|
|
$
|
1.99
|
|
|
$
|
1.80
|
|
|
Diluted
|
|
$
|
1.82
|
|
|
$
|
0.14
|
|
|
$
|
1.74
|
|
|
$
|
(0.44)
|
|
|
$
|
0.68
|
|
|
$
|
1.99
|
|
|
$
|
1.80
|
|
|
|
|
|
|
|
|
|
|
|
|
|
|
|
|
|
Weighted-average shares of common stock outstanding:
|
|
|
|
|
|
|
|
|
|
|
|
|
|
|
|
Basic
|
|
124,333
|
|
|
121,433
|
|
|
114,175
|
|
|
112,120
|
|
|
111,433
|
|
|
122,883
|
|
|
111,245
|
|
|
Diluted
|
|
124,448
|
|
|
121,785
|
|
|
114,974
|
|
|
112,120
|
|
|
111,501
|
|
|
123,117
|
|
|
111,279
|
|
|
|
|
|
|
|
|
|
|
|
|
|
|
|
|
|
Dividends declared per share of common stock
|
|
$
|
1.06
|
|
|
$
|
1.03
|
|
|
$
|
1.03
|
|
|
$
|
1.00
|
|
|
$
|
1.00
|
|
|
$
|
2.09
|
|
|
$
|
1.97
|
|
|
|
|
(1)
|
Change in income from rentals from 1Q20 comprise a $5.4 million decrease in tenant recoveries as a result of lower variable operating expenses, including our utility costs and restaurant-related expenses, partially offset by a $3.6 million increase in rental revenue driven by recently acquired operating properties and continued rental rate growth in lease renewals within our key submarkets.
|
|
(2)
|
Includes a $10 million impairment charge to reduce the carrying amount of a pre-acquisition deposit to zero dollars, concurrently with the submission of our notice to terminate the acquisition that was pending at the time.
|
|
Consolidated Balance Sheets
June 30, 2020
(In thousands)
|
|
|
|
6/30/20
|
|
3/31/20
|
|
12/31/19
|
|
9/30/19
|
|
6/30/19
|
|
Assets
|
|
|
|
|
|
|
|
|
|
|
|
Investments in real estate
|
|
$
|
16,281,125
|
|
|
$
|
15,832,182
|
|
|
$
|
14,844,038
|
|
|
$
|
13,618,280
|
|
|
$
|
12,872,824
|
|
|
Investments in unconsolidated real estate joint ventures
|
|
326,858
|
|
|
325,665
|
|
|
346,890
|
|
|
340,190
|
|
|
334,162
|
|
|
Cash and cash equivalents
|
|
206,860
|
|
|
445,255
|
|
|
189,681
|
|
|
410,675
|
|
|
198,909
|
|
|
Restricted cash
|
|
34,680
|
|
|
43,116
|
|
|
53,008
|
|
|
42,295
|
|
|
39,316
|
|
|
Tenant receivables
|
|
7,208
|
|
|
14,976
|
|
|
10,691
|
|
|
10,668
|
|
|
9,228
|
|
|
Deferred rent
|
|
688,749
|
|
|
663,926
|
|
|
641,844
|
|
|
615,817
|
|
|
585,082
|
|
|
Deferred leasing costs
|
|
274,483
|
|
|
269,458
|
|
|
270,043
|
|
|
252,772
|
|
|
247,468
|
|
|
Investments
|
|
1,318,465
|
|
|
1,123,482
|
|
|
1,140,594
|
|
|
990,454
|
|
|
1,057,854
|
|
|
Other assets
|
|
930,680
|
|
|
983,875
|
|
|
893,714
|
|
|
777,003
|
|
|
694,627
|
|
|
Total assets
|
|
$
|
20,069,108
|
|
|
$
|
19,701,935
|
|
|
$
|
18,390,503
|
|
|
$
|
17,058,154
|
|
|
$
|
16,039,470
|
|
|
|
|
|
|
|
|
|
|
|
|
|
Liabilities, Noncontrolling Interests, and Equity
|
|
|
|
|
|
|
|
|
|
|
|
Secured notes payable
|
|
$
|
344,784
|
|
|
$
|
347,136
|
|
|
$
|
349,352
|
|
|
$
|
351,852
|
|
|
$
|
354,186
|
|
|
Unsecured senior notes payable
|
|
6,738,486
|
|
|
6,736,999
|
|
|
6,044,127
|
|
|
6,042,831
|
|
|
5,140,914
|
|
|
Unsecured senior lines of credit
|
|
440,000
|
|
|
221,000
|
|
|
384,000
|
|
|
343,000
|
|
|
514,000
|
|
|
Unsecured senior bank term loan
|
|
—
|
|
|
—
|
|
|
—
|
|
|
—
|
|
|
347,105
|
|
|
Accounts payable, accrued expenses, and other liabilities
|
|
1,343,181
|
|
|
1,352,554
|
|
|
1,320,268
|
|
|
1,241,276
|
|
|
1,157,417
|
|
|
Dividends payable
|
|
133,681
|
|
|
129,981
|
|
|
126,278
|
|
|
115,575
|
|
|
114,379
|
|
|
Total liabilities
|
|
9,000,132
|
|
|
8,787,670
|
|
|
8,224,025
|
|
|
8,094,534
|
|
|
7,628,001
|
|
|
|
|
|
|
|
|
|
|
|
|
|
Commitments and contingencies
|
|
|
|
|
|
|
|
|
|
|
|
|
|
|
|
|
|
|
|
|
|
|
Redeemable noncontrolling interests
|
|
12,122
|
|
|
12,013
|
|
|
12,300
|
|
|
12,099
|
|
|
10,994
|
|
|
|
|
|
|
|
|
|
|
|
|
|
Alexandria Real Estate Equities, Inc.'s stockholders' equity:
|
|
|
|
|
|
|
|
|
|
|
|
7.00% Series D cumulative convertible preferred stock
|
|
—
|
|
|
—
|
|
|
—
|
|
|
57,461
|
|
|
57,461
|
|
|
Common stock
|
|
1,246
|
|
|
1,243
|
|
|
1,208
|
|
|
1,132
|
|
|
1,120
|
|
|
Additional paid-in capital
|
|
9,443,274
|
|
|
9,336,949
|
|
|
8,874,367
|
|
|
7,743,188
|
|
|
7,581,573
|
|
|
Accumulated other comprehensive loss
|
|
(13,080)
|
|
|
(15,606)
|
|
|
(9,749)
|
|
|
(11,549)
|
|
|
(11,134)
|
|
|
Alexandria Real Estate Equities, Inc.'s stockholders' equity
|
|
9,431,440
|
|
|
9,322,586
|
|
|
8,865,826
|
|
|
7,790,232
|
|
|
7,629,020
|
|
|
Noncontrolling interests
|
|
1,625,414
|
|
|
1,579,666
|
|
|
1,288,352
|
|
|
1,161,289
|
|
|
771,455
|
|
|
Total equity
|
|
11,056,854
|
|
|
10,902,252
|
|
|
10,154,178
|
|
|
8,951,521
|
|
|
8,400,475
|
|
|
Total liabilities, noncontrolling interests, and equity
|
|
$
|
20,069,108
|
|
|
$
|
19,701,935
|
|
|
$
|
18,390,503
|
|
|
$
|
17,058,154
|
|
|
$
|
16,039,470
|
|
|
Funds From Operations and Funds From Operations per Share
June 30, 2020
(In thousands)
|
|
|
The following table presents a reconciliation of net income (loss) attributable to Alexandria's common stockholders, the most directly comparable financial measure presented in accordance with generally accepted accounting principles ("GAAP"), including our share of amounts from consolidated and unconsolidated real estate joint ventures, to funds from operations attributable to Alexandria's common stockholders – diluted, and funds from operations attributable to Alexandria's common stockholders – diluted, as adjusted, for the periods below:
|
|
|
|
Three Months Ended
|
|
Six Months Ended
|
|
|
6/30/20
|
|
3/31/20
|
|
12/31/19
|
|
9/30/19
|
|
6/30/19
|
|
6/30/20
|
|
6/30/19
|
|
Net income (loss) attributable to Alexandria's common stockholders
|
|
$
|
226,600
|
|
|
$
|
16,840
|
|
|
$
|
199,618
|
|
|
$
|
(49,773)
|
|
|
$
|
76,330
|
|
|
$
|
244,845
|
|
|
$
|
200,181
|
|
|
Depreciation and amortization of real estate assets(1)
|
|
165,040
|
|
|
172,628
|
|
|
137,761
|
|
|
135,570
|
|
|
134,437
|
|
|
337,668
|
|
|
268,524
|
|
|
Noncontrolling share of depreciation and amortization from consolidated real
estate JVs
|
|
(15,775)
|
|
|
(15,870)
|
|
|
(10,176)
|
|
|
(8,621)
|
|
|
(6,744)
|
|
|
(31,645)
|
|
|
(12,163)
|
|
|
Our share of depreciation and amortization from unconsolidated real estate JVs
|
|
2,858
|
|
|
2,643
|
|
|
2,702
|
|
|
1,845
|
|
|
973
|
|
|
5,501
|
|
|
1,819
|
|
|
Gain on sales of real estate
|
|
—
|
|
|
—
|
|
|
(474)
|
|
|
—
|
|
|
—
|
|
|
—
|
|
|
—
|
|
|
Impairment of real estate – rental properties
|
|
—
|
|
|
7,644
|
|
|
12,334
|
|
|
—
|
|
|
—
|
|
|
7,644
|
|
|
—
|
|
|
Assumed conversion of 7.00% Series D cumulative convertible preferred stock
|
|
—
|
|
|
—
|
|
|
—
|
|
|
—
|
|
|
1,005
|
|
|
—
|
|
|
2,031
|
|
|
Allocation to unvested restricted stock awards
|
|
(2,228)
|
|
|
(847)
|
|
|
(1,809)
|
|
|
—
|
|
|
(1,445)
|
|
|
(4,531)
|
|
|
(3,740)
|
|
|
Funds from operations attributable to Alexandria's common stockholders –
diluted(1)
|
|
376,495
|
|
|
183,038
|
|
|
339,956
|
|
|
79,021
|
|
|
204,556
|
|
|
559,482
|
|
|
456,652
|
|
|
Unrealized (gains) losses on non-real estate investments
|
|
(171,652)
|
|
|
17,144
|
|
|
(148,268)
|
|
|
70,043
|
|
|
(11,058)
|
|
|
(154,508)
|
|
|
(83,264)
|
|
|
Impairment of non-real estate investments
|
|
4,702
|
(2)
|
|
19,780
|
|
|
9,991
|
|
|
7,133
|
|
|
—
|
|
|
24,482
|
|
|
—
|
|
|
Impairment of real estate
|
|
13,218
|
(3)
|
|
2,003
|
|
|
—
|
|
|
—
|
|
|
—
|
|
|
15,221
|
|
|
—
|
|
|
Loss on early extinguishment of debt
|
|
—
|
|
|
—
|
|
|
—
|
|
|
40,209
|
|
|
—
|
|
|
—
|
|
|
7,361
|
|
|
Loss on early termination of interest rate hedge agreements
|
|
—
|
|
|
—
|
|
|
—
|
|
|
1,702
|
|
|
—
|
|
|
—
|
|
|
—
|
|
|
Preferred stock redemption charge
|
|
—
|
|
|
—
|
|
|
—
|
|
|
—
|
|
|
—
|
|
|
—
|
|
|
2,580
|
|
|
Removal of assumed conversion of 7.00% Series D cumulative convertible
preferred stock
|
|
—
|
|
|
—
|
|
|
—
|
|
|
—
|
|
|
(1,005)
|
|
|
—
|
|
|
(2,031)
|
|
|
Allocation to unvested restricted stock awards
|
|
2,251
|
|
|
(591)
|
|
|
1,760
|
|
|
(1,002)
|
|
|
179
|
|
|
1,711
|
|
|
1,157
|
|
|
Funds from operations attributable to Alexandria's common stockholders –
diluted, as adjusted
|
|
$
|
225,014
|
|
|
$
|
221,374
|
|
|
$
|
203,439
|
|
|
$
|
197,106
|
|
|
$
|
192,672
|
|
|
$
|
446,388
|
|
|
$
|
382,455
|
|
|
|
|
(1)
|
Calculated in accordance with standards established by the Nareit Board of Governors. Refer to "Funds from operations and funds from operations, as adjusted, attributable to Alexandria's common stockholders" in the "Definitions and reconciliations" of our Supplemental Information for additional details.
|
|
(2)
|
Primarily relates to two investments in privately held entities that do not report NAV.
|
|
(3)
|
Primarily relates to a $10 million impairment charge to write off the pre-acquisition deposit for a previously pending acquisition, which was recognized in April 2020 concurrently with the submission of our notice to terminate the transaction.
|
|
Funds From Operations and Funds From Operations per Share (continued)
June 30, 2020
(In thousands, except per share amounts)
|
|
|
The following table presents a reconciliation of net income (loss) per share attributable to Alexandria's common stockholders, the most directly comparable financial measure presented in accordance with GAAP, including our share of amounts from consolidated and unconsolidated real estate joint ventures, to funds from operations per share attributable to Alexandria's common stockholders – diluted, and funds from operations per share attributable to Alexandria's common stockholders – diluted, as adjusted, for the periods below. Per share amounts may not add due to rounding.
|
|
|
|
Three Months Ended
|
|
Six Months Ended
|
|
|
6/30/20
|
|
3/31/20
|
|
12/31/19
|
|
9/30/19
|
|
6/30/19
|
|
6/30/20
|
|
6/30/19
|
|
Net income (loss) per share attributable to Alexandria's common
stockholders – diluted
|
|
$
|
1.82
|
|
|
$
|
0.14
|
|
|
$
|
1.74
|
|
|
$
|
(0.44)
|
|
|
$
|
0.68
|
|
|
$
|
1.99
|
|
|
$
|
1.80
|
|
|
Depreciation and amortization of real estate assets
|
|
1.22
|
|
|
1.31
|
|
|
1.13
|
|
|
1.14
|
|
|
1.15
|
|
|
2.53
|
|
|
2.32
|
|
|
Impairment of real estate – rental properties
|
|
—
|
|
|
0.06
|
|
|
0.11
|
|
|
—
|
|
|
—
|
|
|
0.06
|
|
|
—
|
|
|
Allocation to unvested restricted stock awards
|
|
(0.01)
|
|
|
(0.01)
|
|
|
(0.02)
|
|
|
—
|
|
|
—
|
|
|
(0.04)
|
|
|
(0.04)
|
|
|
Funds from operations per share attributable to Alexandria's common
stockholders – diluted(1)
|
|
3.03
|
|
|
1.50
|
|
|
2.96
|
|
|
0.70
|
|
|
1.83
|
|
|
4.54
|
|
|
4.08
|
|
|
Unrealized (gains) losses on non-real estate investments
|
|
(1.38)
|
|
|
0.14
|
|
|
(1.29)
|
|
|
0.62
|
|
|
(0.10)
|
|
|
(1.25)
|
|
|
(0.75)
|
|
|
Impairment of non-real estate investments
|
|
0.04
|
(1)
|
|
0.16
|
|
|
0.09
|
|
|
0.06
|
|
|
—
|
|
|
0.20
|
|
|
—
|
|
|
Impairment of real estate
|
|
0.11
|
(1)
|
|
0.02
|
|
|
—
|
|
|
—
|
|
|
—
|
|
|
0.12
|
|
|
—
|
|
|
Loss on early extinguishment of debt
|
|
—
|
|
|
—
|
|
|
—
|
|
|
0.36
|
|
|
—
|
|
|
—
|
|
|
0.07
|
|
|
Loss on early termination of interest rate hedge agreements
|
|
—
|
|
|
—
|
|
|
—
|
|
|
0.02
|
|
|
—
|
|
|
—
|
|
|
—
|
|
|
Preferred stock redemption charge
|
|
—
|
|
|
—
|
|
|
—
|
|
|
—
|
|
|
—
|
|
|
—
|
|
|
0.02
|
|
|
Allocation to unvested restricted stock awards
|
|
0.01
|
|
|
—
|
|
|
0.01
|
|
|
(0.01)
|
|
|
—
|
|
|
0.02
|
|
|
0.02
|
|
|
Funds from operations per share attributable to Alexandria's common
stockholders – diluted, as adjusted
|
|
$
|
1.81
|
|
|
$
|
1.82
|
|
|
$
|
1.77
|
|
|
$
|
1.75
|
|
|
$
|
1.73
|
|
|
$
|
3.63
|
|
|
$
|
3.44
|
|
|
|
|
|
|
|
|
|
|
|
|
|
|
|
|
|
Weighted-average shares of common stock outstanding(2) for calculations of:
|
|
|
|
|
|
|
|
|
|
|
|
|
|
|
|
Earnings per share – diluted
|
|
124,448
|
|
|
121,785
|
|
|
114,974
|
|
|
112,120
|
|
|
111,501
|
|
|
123,117
|
|
|
111,279
|
|
|
Funds from operations – diluted, per share
|
|
124,448
|
|
|
121,785
|
|
|
114,974
|
|
|
112,562
|
|
|
112,077
|
|
|
123,117
|
|
|
111,857
|
|
|
Funds from operations – diluted, as adjusted, per share
|
|
124,448
|
|
|
121,785
|
|
|
114,974
|
|
|
112,562
|
|
|
111,501
|
|
|
123,117
|
|
|
111,279
|
|
|
|
|
|
|
|
|
|
|
|
|
|
|
|
|
|
(1)
|
Refer to footnotes on the previous page for additional details.
|
|
(2)
|
Refer to "Weighted-average shares of common stock outstanding – diluted" in the "Definitions and reconciliations" of our Supplemental Information for additional details.
|
 View original content to download multimedia:http://www.prnewswire.com/news-releases/alexandria-real-estate-equities-inc-reports-2q20-revenues-of-437-0-million-up-16-9-over-2q19-2q20-and-1h20-net-income-per-share--diluted-of-1-82-and-1-99--respectively-2q20-and-1h20-ffo-per-share--diluted-as-adjusted-301100403.html
SOURCE Alexandria Real Estate Equities, Inc.